コード
import numpy as np

ro, rd = np.array([1, 2]), np.array([4, 2])
rd = rd / np.linalg.norm(rd)

b_min, b_max = np.array([2, 2]), np.array([4, 4])

t0 = (b_min - ro) / rd
t1 = (b_max - ro) / rd光線は,始点ベクトル \(\boldsymbol{o}\) と方向ベクトル \(\boldsymbol{d}\) を用いて,次のようなパラメトリック形式で表される.
\[ \boldsymbol{P}(t)=\boldsymbol{o}+t\boldsymbol{d} \]
軸平行境界ボックス(Axis-Aligned Bounding Box, AABB)との交点を求めるには,光線が各境界面に到達するパラメータ \(t\) を計算すればよい.
\[ \begin{cases} \boldsymbol{P}(t)=\boldsymbol{b}_{min}\\ \boldsymbol{P}(t)=\boldsymbol{b}_{max} \end{cases} \]
各次元 \(i\) ごとに,光線がその軸方向のスラブ面(\(b_{min,i},b_{max,i}\))に到達するパラメータ値は,次のように求められる.
\[ \begin{align*} t_{0, i}&=\frac{b_{min,i} - o_{i}}{d_{i}}\\ t_{1, i}&=\frac{b_{max,i} - o_{i}}{d_{i}} \end{align*} \]
各軸での交差区間の共通部分から,全体の交差区間を求めることができる.
import numpy as np
ro, rd = np.array([1, 2]), np.array([4, 2])
rd = rd / np.linalg.norm(rd)
b_min, b_max = np.array([2, 2]), np.array([4, 4])
t0 = (b_min - ro) / rd
t1 = (b_max - ro) / rd光線パラメータ \(t\) を横軸に,縦軸に各軸方向のスラブ区間を並べ,光線がその区間を通過する様子を視覚的に示す.
import matplotlib.pyplot as plt
from matplotlib import font_manager


# print(plt.style.available)
plt.style.use("seaborn-v0_8")


def plot_slabs(t0, t1, ax):
    COLORS = ["red", "green", "blue"]

    num_dim = ro.size
    t_inf, t_sup = 0.0, np.inf
    t_min, t_max = np.empty(num_dim), np.empty(num_dim)

    for i in range(num_dim):
        t_min[i], t_max[i] = np.fmin(t0[i], t1[i]), np.fmax(t0[i], t1[i])
        t_inf, t_sup = np.fmax(t_inf, t_min[i]), np.fmin(t_sup, t_max[i])

    has_overlap = t_inf < t_sup

    for i in range(num_dim):
        if not np.isfinite(t_min[i]) or not np.isfinite(t_max[i]):
            continue

        y = num_dim - i
        color = COLORS[i]

        lo, hi = t_min[i], t_max[i]
        ax.hlines(y, xmin=lo, xmax=hi, label=f"axis-{i}", color=color, linewidth=1, alpha=0.5)
        ax.plot(lo, y, color=color, marker="v", label=f"entry: {lo:.3f}")
        ax.plot(hi, y, color=color, marker="^", label=f"exit: {hi:.3f}")

        if has_overlap:
            ax.vlines(lo, ymin=0, ymax=y, colors="black", linestyles="--", linewidth=1, alpha=0.5)
            ax.vlines(hi, ymin=0, ymax=y, colors="black", linestyles="--", linewidth=1, alpha=0.5)

    if has_overlap:
        lo, hi = np.min(t_min[np.isfinite(t_min)]), np.max(t_max[np.isfinite(t_max)])
        ax.hlines(0, xmin=lo, xmax=hi, colors="gray", linestyles="--", linewidth=1, alpha=0.5)

        color = "orange"
        ax.hlines(0, xmin=t_inf, xmax=t_sup, colors=color, label=f"t", linewidth=1, alpha=0.5)
        ax.plot(t_inf, 0, color=color, marker="v", label=f"entry: {t_inf:.3f}")
        ax.plot(t_sup, 0, color=color, marker="^", label=f"exit: {t_sup:.3f}")
    else:
        ax.plot([], [], color="black", linestyle="-.", label="No overlap between slabs")


fig, ax = plt.subplots(figsize=(5, 5), constrained_layout=True)

plot_slabs(t0, t1, ax)

# Styling and layout
ax.set_title("Slabs")
ax.set_xlabel("t")
ax.margins(x=0.25, y=0.25)
ax.get_yaxis().set_visible(False)
ax.set_aspect("equal", adjustable="box")
ax.grid(True)

ax.legend(
    loc="upper left",
    bbox_to_anchor=(1.02, 1),
    borderaxespad=0.0,
    prop=font_manager.FontProperties(family="monospace", size=8),
)

plt.show()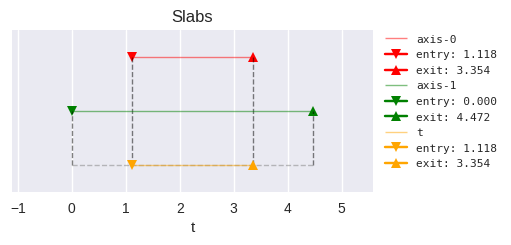
ここでは,分岐なしのスラブ法を実装する(詳細は Tavianator, 2022 を参照).
実装上の注意点としては以下がある.
def intersect(ro: np.ndarray, rd: np.ndarray, b_min: np.ndarray, b_max: np.ndarray) -> tuple[bool, float, float]:
    t_min, t_max = 0.0, np.inf  # Ray interval

    for i in range(ro.size):
        # inv_d may become inf if rd[i] == 0 (IEEE 754: 1/0 = inf).
        inv_d = 1.0 / rd[i]
        # t0 or t1 may be NaN when 0 * inf occurs.
        t0 = (b_min[i] - ro[i]) * inv_d
        t1 = (b_max[i] - ro[i]) * inv_d

        # fmin/fmax ignore NaN and return the valid value.
        t_min = np.fmax(t_min, np.fmin(t0, t1))  # Entry point
        t_max = np.fmin(t_max, np.fmax(t0, t1))  # Exit point

    # t_min == t_max occurs when ray grazes a degenerate (zero-thickness) box → no hit.
return t_min < t_max, t_min, t_maxis_hit, t_min, t_max = intersect(ro, rd, b_min, b_max)
print(f"{is_hit=}, {t_min=}, {t_max=}")is_hit=np.True_, t_min=np.float64(1.118033988749895), t_max=np.float64(3.3541019662496847)def plot_scene(ro, rd, b_min, b_max, is_hit, t_min, t_max, ax):
extent = b_max - b_min
# AABB
rect = plt.Rectangle(b_min, extent[0], extent[1], edgecolor="black", facecolor="none", linewidth=1, hatch="//", label="AABB")
ax.add_patch(rect)
# Ray
ax.quiver(*ro, *rd, angles="xy", scale_units="xy", scale=1, color="black", label="Ray")
# Hit
if is_hit:
entry_pos = ro + t_min * rd
exit_pos = ro + t_max * rd
ax.plot(*np.vstack([entry_pos, exit_pos]).T, color="crimson", linestyle="--", linewidth=1, label="Intersection")
ax.plot(*entry_pos, color="crimson", marker="v", label="Entry")
ax.plot(*exit_pos, color="crimson", marker="^", label="Exit")
fig, axes = plt.subplots(nrows=1, ncols=2, figsize=(10, 5), constrained_layout=True)
plot_scene(ro, rd, b_min, b_max, is_hit, t_min, t_max, axes[0])
plot_slabs(t0, t1, axes[1])
# Styling and layout
ax = axes[0]
ax.set_title("Slab method")
ax.margins(x=0.5, y=0.5)
ax.set_aspect("equal", adjustable="box")
ax.grid(True)
ax.legend(
loc="upper left",
bbox_to_anchor=(1.02, 1),
borderaxespad=0.0,
prop=font_manager.FontProperties(family="monospace", size=8),
)
ax = axes[1]
ax.set_title("Slabs")
ax.set_xlabel("t")
ax.margins(x=0.25, y=0.25)
ax.get_yaxis().set_visible(False)
ax.set_aspect("equal", adjustable="box")
ax.grid(True)
ax.legend(
loc="upper left",
bbox_to_anchor=(1.02, 1),
borderaxespad=0.0,
prop=font_manager.FontProperties(family="monospace", size=8),
)
plt.show()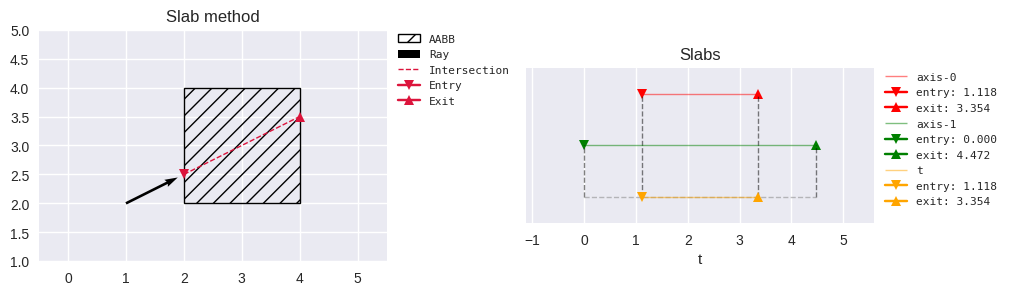
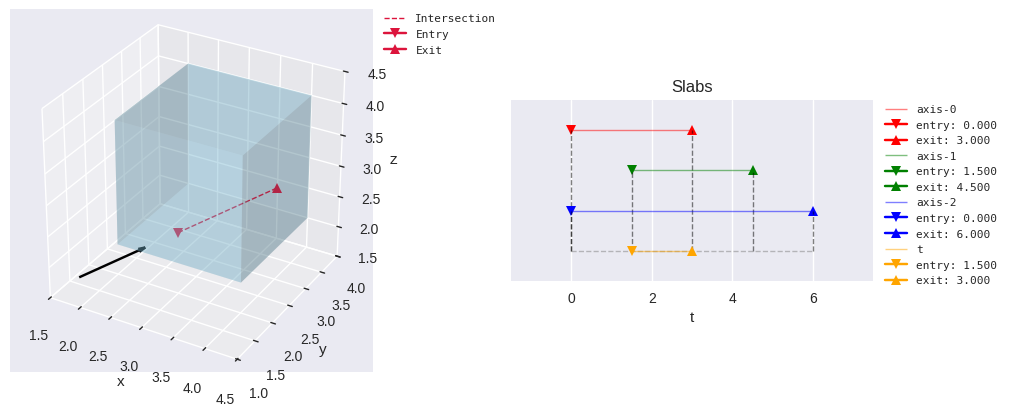
ro, rd = np.array([2, 1, 2]), np.array([4, 4, 2])
rd = rd / np.linalg.norm(rd)
b_min = np.array([2.0, 2.0, 2.0])
b_max = np.array([4.0, 4.0, 4.0])
t0 = (b_min - ro) / rd
t1 = (b_max - ro) / rd
is_hit, t_min, t_max = intersect(ro, rd, b_min, b_max)
print(f"{is_hit=}, {t_min=}, {t_max=}")
is_hit=np.True_, t_min=np.float64(1.5), t_max=np.float64(3.0)from mpl_toolkits.mplot3d import Axes3D
def plot_aabb(b_min, b_max, ax, **kwargs):
x, y, z = b_min[0], b_min[1], b_min[2]
X, Y, Z = b_max[0], b_max[1], b_max[2]
faces = [
("z", x, X, y, Y, z), # bottom
("z", x, X, y, Y, Z), # top
("y", x, X, z, Z, y), # front
("y", x, X, z, Z, Y), # back
("x", y, Y, z, Z, x), # left
("x", y, Y, z, Z, X), # right
]
for axis, a0, a1, b0, b1, fixed in faces:
aa, bb = np.meshgrid([a0, a1], [b0, b1])
surf = {"x": (np.full_like(aa, fixed), aa, bb), "y": (aa, np.full_like(aa, fixed), bb), "z": (aa, bb, np.full_like(aa, fixed))}[axis]
ax.plot_surface(*surf, **kwargs)
def plot_scene_3d(ro, rd, b_min, b_max, is_hit, t_min, t_max, ax):
extent = b_max - b_min
# AABB
plot_aabb(b_min, b_max, ax, color="skyblue", alpha=0.25)
# Ray
ax.quiver(*ro, *rd, length=1.0, normalize=True, color="black", arrow_length_ratio=0.1)
#
if is_hit:
entry_pos = ro + t_min * rd
exit_pos = ro + t_max * rd
ax.plot(*np.vstack([entry_pos, exit_pos]).T, color="crimson", linestyle="--", linewidth=1, label="Intersection")
ax.plot(*entry_pos, color="crimson", marker="v", label="Entry")
ax.plot(*exit_pos, color="crimson", marker="^", label="Exit")
pts = [b_min, b_max, ro, ro + rd]
lower, upper = np.min(pts, axis=0), np.max(pts, axis=0)
center = 0.5 * (lower + upper)
extent = upper - lower
half_max_extent = 0.5 * np.max(extent)
ax.set_xlim(center[0] - half_max_extent, center[0] + half_max_extent)
ax.set_ylim(center[1] - half_max_extent, center[1] + half_max_extent)
ax.set_zlim(center[2] - half_max_extent, center[2] + half_max_extent)
ax.set_box_aspect([1, 1, 1])
fig = plt.figure(figsize=(10, 5), constrained_layout=True)
ax0 = fig.add_subplot(121, projection="3d")
ax1 = fig.add_subplot(122)
plot_scene_3d(ro, rd, b_min, b_max, is_hit, t_min, t_max, ax0)
plot_slabs(t0, t1, ax1)
# Styling and layout
ax = ax0
ax.set_xlabel("x")
ax.set_ylabel("y")
ax.set_zlabel("z")
ax.legend(
loc="upper left",
bbox_to_anchor=(1.02, 1),
borderaxespad=0.0,
prop=font_manager.FontProperties(family="monospace", size=8),
)
ax = ax1
ax.set_title("Slabs")
ax.set_xlabel("t")
ax.margins(x=0.25, y=0.25)
ax.get_yaxis().set_visible(False)
ax.set_aspect("equal", adjustable="box")
ax.grid(True)
ax.legend(
loc="upper left",
bbox_to_anchor=(1.02, 1),
borderaxespad=0.0,
prop=font_manager.FontProperties(family="monospace", size=8),
)
plt.show()